1. What do you get?
Would you like to learn more about your wine?
Take advantage of the manifold possibilities of a NMR analysis!
- Quantitative determination of ingredients

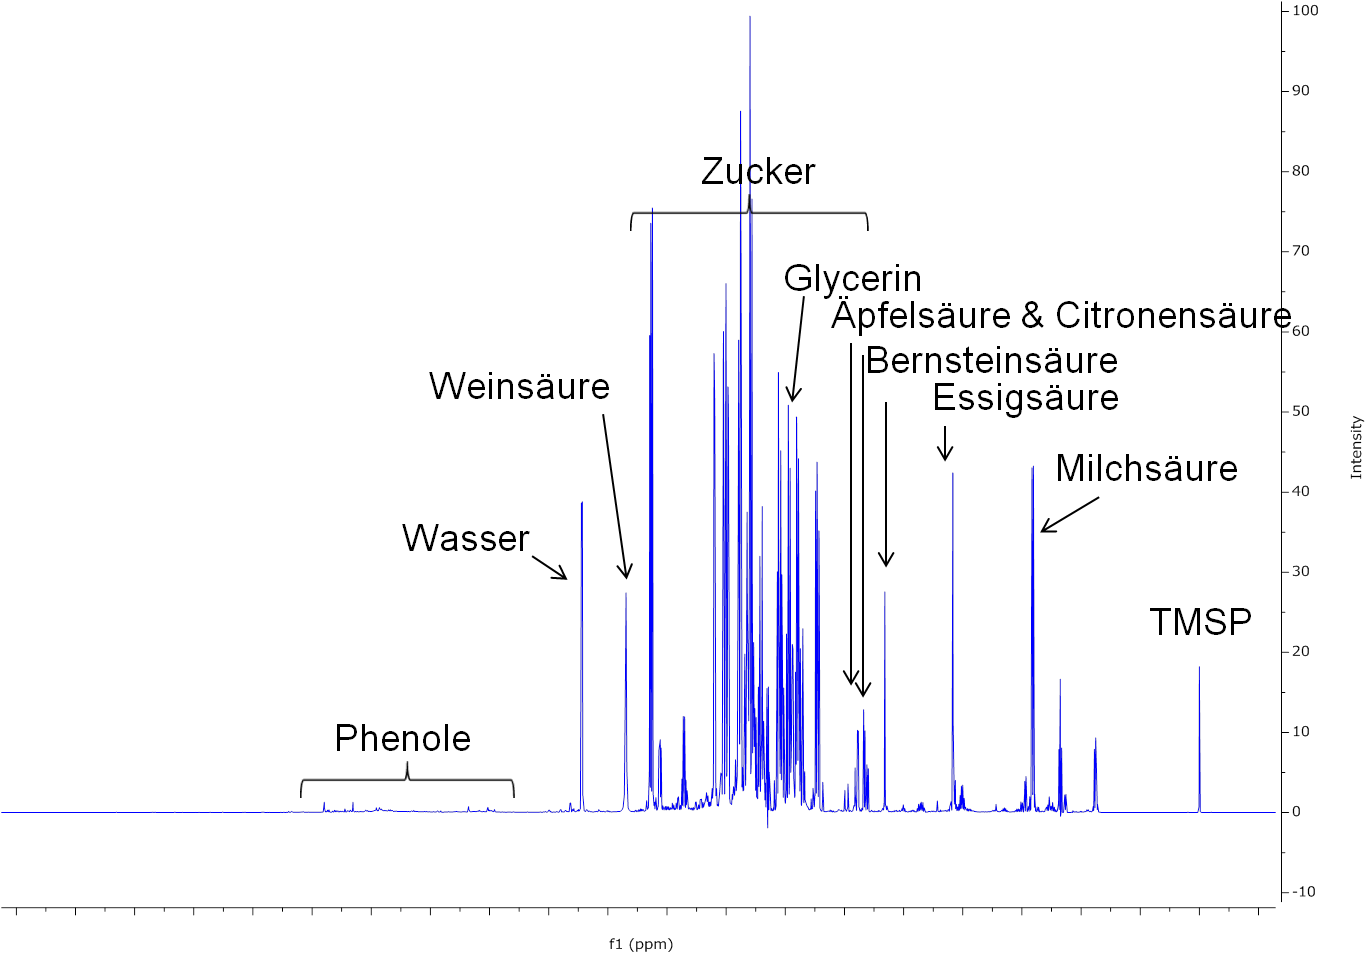
Figure1: Spektrum of a wine with labeling of important signals
- Comparison of samples / Proof of identity
- Metabolomics
2. Quantification
Sugars and organic acids – that’s nothing new. But a NMR spectrum offers much more information.
Would you like to know if your grapes were infected by botrytis? You need a statement about potential bacterial spoilage of the grapes? – We find the answers for you in the NMR spectrum.
- Wine contents about 150 detectable substances
- Simultaneous determination of 31 or 70 parameters, respectively
- Sugars (glucose, fructose, sucrose)
- Alcohols & other fermentation products (ethanol, glycerol, methanol, acetaldehyde (free & bound to SO2), acetoin, 1,3 propanediol, ethyl acetate, tyrosol)
- Organic acids (tartaric acid, malic acid, shikimic acid, lactic acid, acetic acid, citric acid, succinic acid, fumaric acid, ascorbic acid, formic acid, galacturonic acid, gluconic acid.

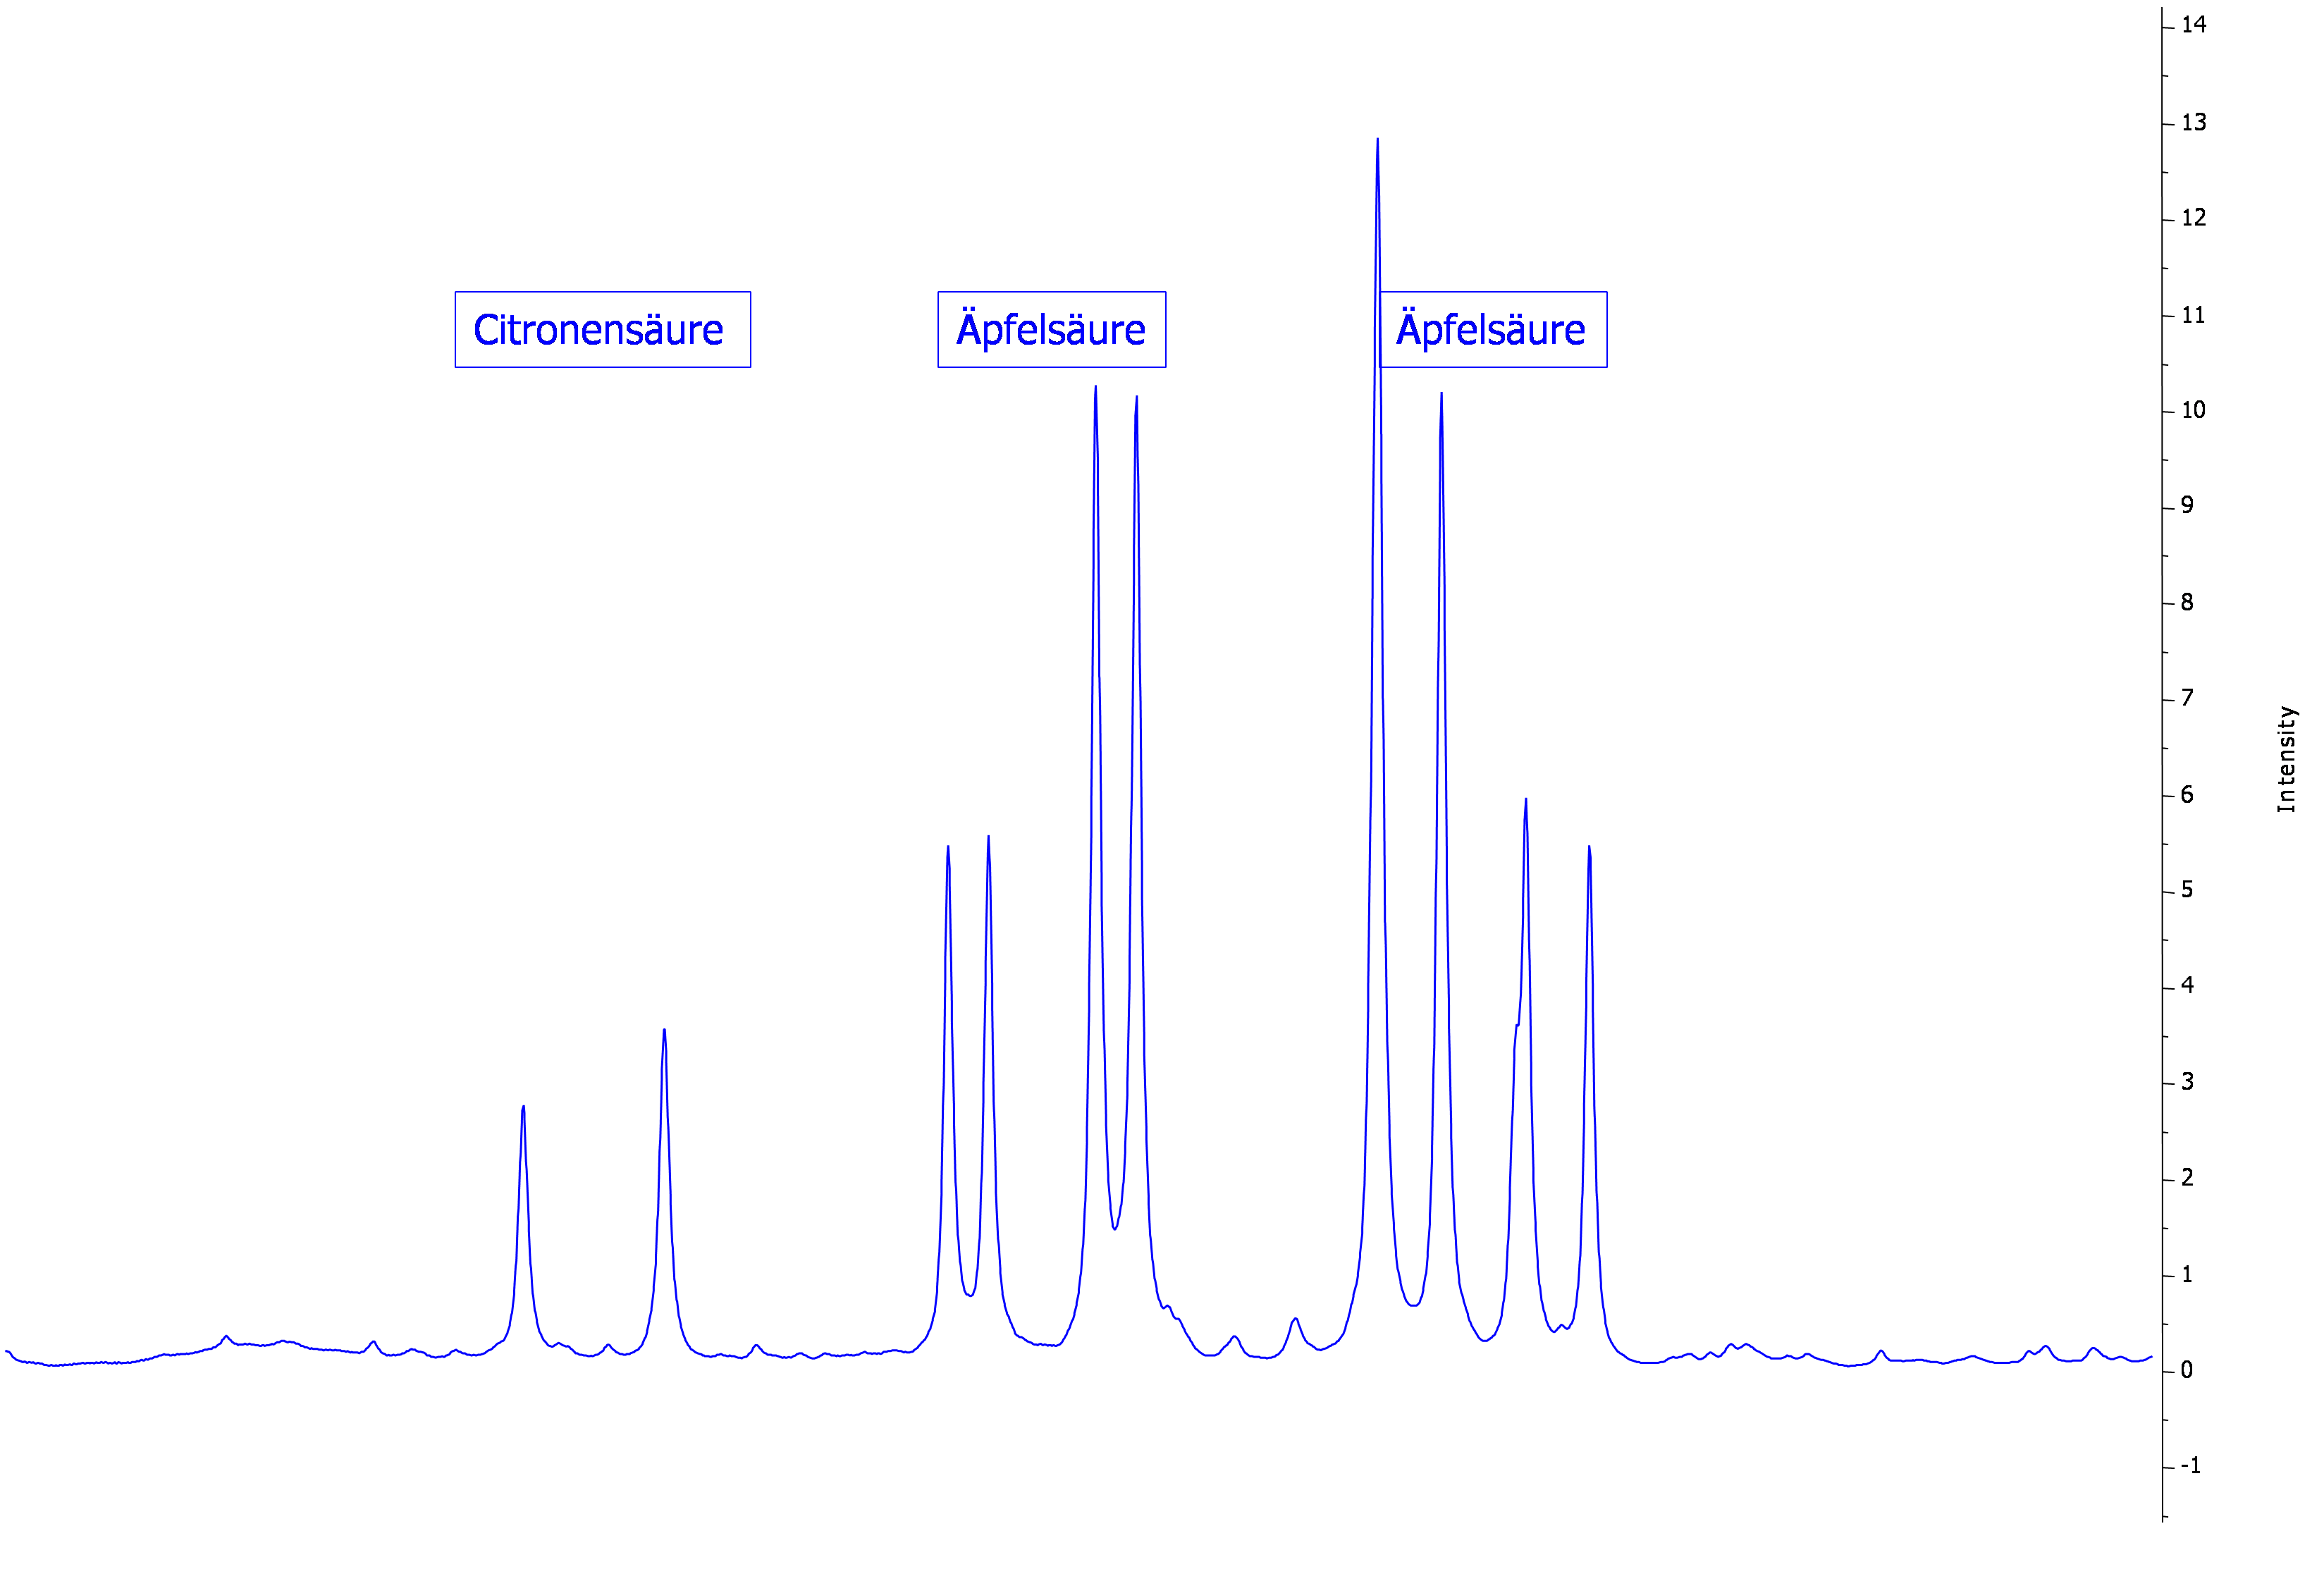
Figure 2: Extract from the whole spectrum of a wine with lableing of the signals of citric and malic acid
- Preservatives (sorbic acid, benzoic acid, salicylic acid)
- Amino acids (proline)
- Phenolic compounds (catechin, epicatechin)
- Other ingredients (HMF, furfural)
- The limits of detection can be – depending on the compound – smaller than 1 mg/l.
- NMR analysis is in contrast to other analytical methods applicable to a wide range of concentrations from 0.3 mg/l to more than 100 g/l.
- You get a detailed review of your wine
-
Example for the usage of NMR: Proof of a botrytis infection
In order to find out which parameters can be used as markers for botrytis infection, must of grapes with and without botrytis infection have been measured. The analogous spectra have been measured after fermentation as well.
-
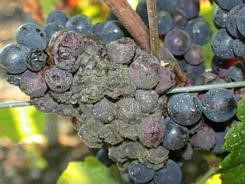
Figure 3: Grapes with botrytis infection
- Galacturonic acid for example is a good tracer for botrytis infection, because its whole concentration originates from botrytis infection and the concentration is not changed during the fermentation process.
-
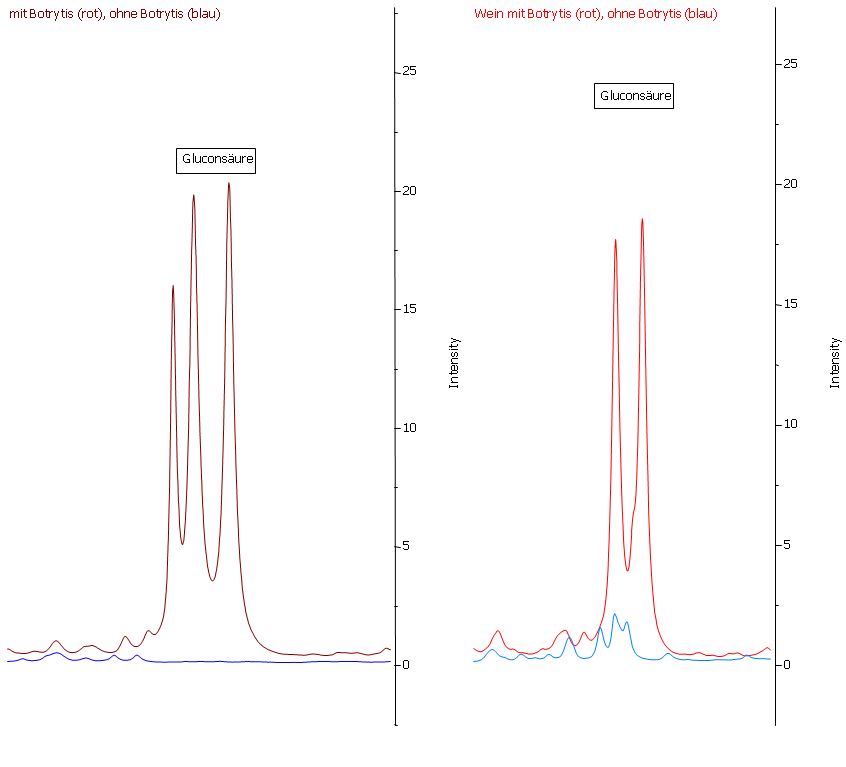
Figure 4: Peaks of galacturonic acid in must (left) and wine (right) from grapes with (red) and without (blue) botrytis infection
- In combination with other parameters consolidated findings about the botrytis infection of the grapes can be gained.
-

Figure 5: Detail from the comparison of juice of grapes without (blue lines) and with (red lines) botrytis infection

3. Comparison of samples
The credo “Trust is good, control is better” could be yours? Would you like to ensure that your wine neither diluted with water nor mixed with another wine? The NMR analysis can help you.
Every wine yields a spectrum that is due to 150 detectable substances unique like a fingerprint and can be used for the identification of that wine.
Due to the fact that the spectra are accurately reproducible – even with a large time delay between the two measurements – the identity of two or more samples can be proven.
Possible applications are product control after breaking official seals or the documentation of temporal changes in the sample.
The analysis of only a few parameters like ethanol, glycerol, glucose, fructose, tartaric acid, acetic acid, malic acid citric acid and lactic acid would make it possible to hush up the dilution with water if these substances are added in the concentration afterwards. De facto this is not possible for 150 substances that are detected by NMR.
A dilution with water can be proven doubtlessly even if the main components have been added.
While pyruvic acid is added to at least one of the samples (red line) the concentration of proline are significantly reduced. The lowering of the intensities of nearly all signals and so the lowering of nearly all concentrations prove the dilution of wine with water.
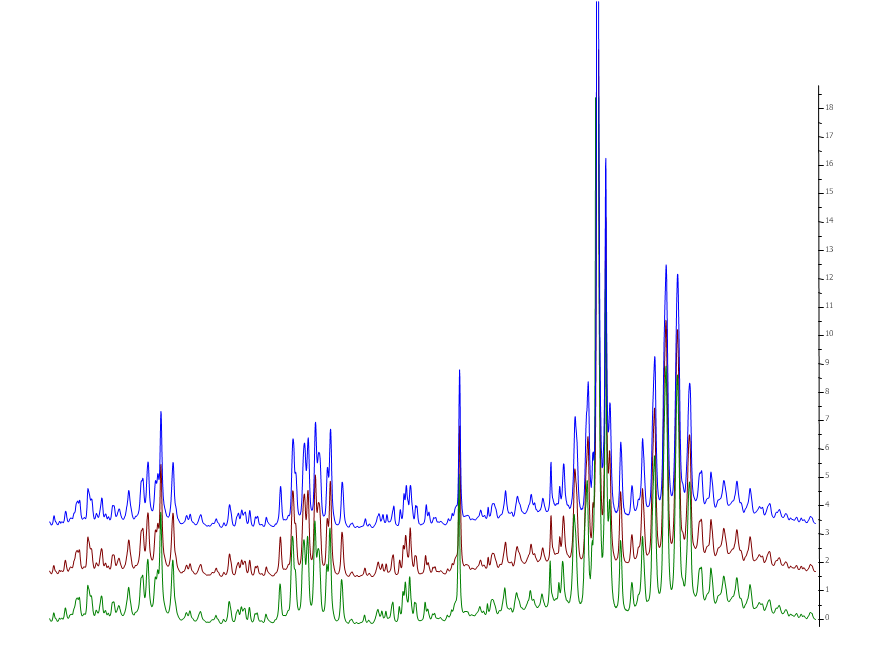
Figure 6: Comparison of three identical white wine samples (only part of the spectrum shown)
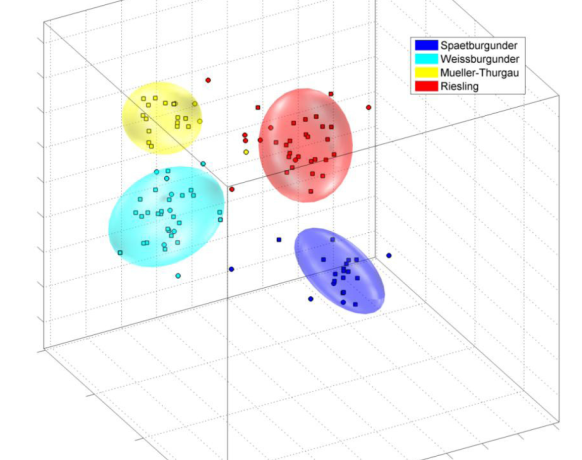
4. Metabolomics
The combination of ingredients leads to spectrum that is unique like a fingerprint. The additional fact that similar wines, which means similar concentrations of ingredients, lead to similar spectra make it possible to use statistical methods to determine:
- Variety:

- Origin:

- Storage in Oak barrels or use of oak chips:

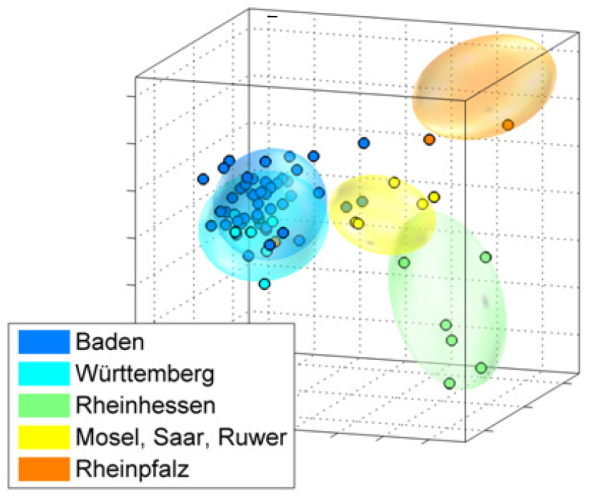
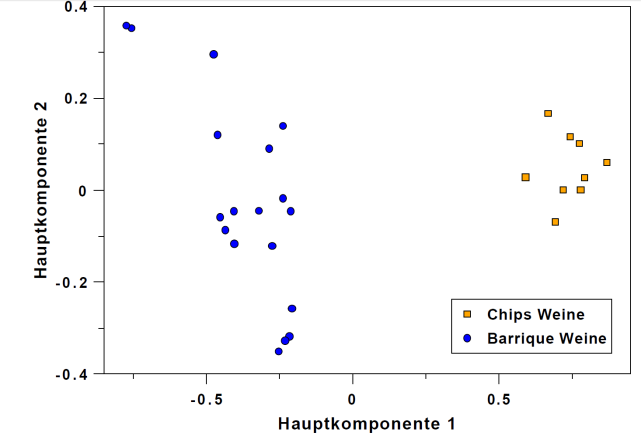
Multivariate statistics are used to compare a sample to a bunch of samples in a database whose origins for example are known. The databases are under construction.
7. Summary and outlook
- Beside the wine, all other clear liquids can be analysed as well. The following products have already been analyzed:
- Vinegar
- Juice
- Spirits
- Beer
- Special diluted liquids and reaction mixures
- In futre we also will analyse the following products:
- olive oils
- other edible oils
- Solids, like effervescent tablets, which can be solved in solents